Inhibition
of myosin II triggers morphological transition and increased nuclear motility
B. Szabó 1, Renáta Ünnep 1,
Károly Markó 2, Zsuzsanna Környei 2, Előd Méhes 1and
András Czirók1,3
1 Department of Biological Physics, Eötvös University, Budapest, Hungary.
2 Institute of Experimental Medicine, Hungarian Academy of Sciences, Budapest, Hungary.
3 Department of Anatomy & Cell Biology, University of Kansas Medical Center, Kansas City, KS, USA.
Abstract
We investigate the effect of myosin II inhibition on cell shape and
nuclear motility in cultures of mouse radial glia-like neural
progenitor and rat glioma C6 cells. Instead of reducing nucleokinesis,
the myosin II inhibitor blebbistatin provokes an elongated bipolar
morphology and increased nuclear motility in both cell types. When
myosin II is active, time-resolved traction
force measurements indicate a pulling force between the leading edge
and the nucleus of C6 cells. In the absence of myosin II activity,
traction forces during nucleokinesis are diminished below
the sensitivity threshold of our assay. By visualizing the centrosome
position in C6 cells with GFP-centrin, we show that in the presence
or absence of myosin II activity the nucleus tends
to overtake or lag behind the centrosome, respectively. We interpret
these findings with the help of a simple viscoelastic model of the
cytoskeleton consisting active contractile and passive compressed
elements.
Cell Motil. Cytoskeleton 68(6), 325-39, 2011.
Key words: interkinetic nuclear migration, radial glia, centrosome, tensegrity, blebbistatin, traction force
PDF
Figures
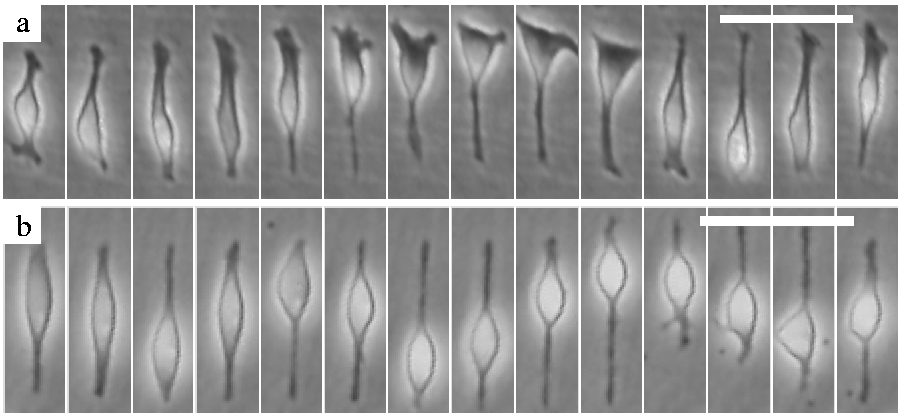
Figure 1: Radial glia-like cells engage in an oscillatory nuclear motion, similar to INM. Image sequences, with a rate of 10 min/frame, depict an
untreated (a) and a blebbistatin-treated (20 μM) cell (b). The nucleus of most blebbistatin treated radial
glia-like cells becomes extremely motile. Phase contrast images, scale bars: 50 μm. See also movies 1 and 2.

Figure 2: Blebbistatin induced morphology change in radial glia-like (a,b) and C6 cells (c,d). When compared to control (DMSO treated) cells (a, c),
20 μM blebbistatin (b, d) induces a bipolar morphology: most cells exhibit two extremely narrow processes with
the soma in between. Both cell types arrange into a sparse meshwork. The inactive blebbistatin enantiomer, shown here
also at 20 μM, is indistinguishable from untreated cells (e). The ROCK inhibitor Y27632 induces a morphology and
motility switch similar to that of blebbistatin. In panel (f) the response is shown for 40 μM Y27632. 20 μM
ML7, an MLCK inhibitor, reduces cell spreading, but does not result in bipolar morphologies or fast moving nuclei (g).
The combined treatment with ML7 and Y27632 results in bipolar morphologies in a larger population of cells (h).
Phase contrast images, scale bar: 100 μm. See also movies 3-6.
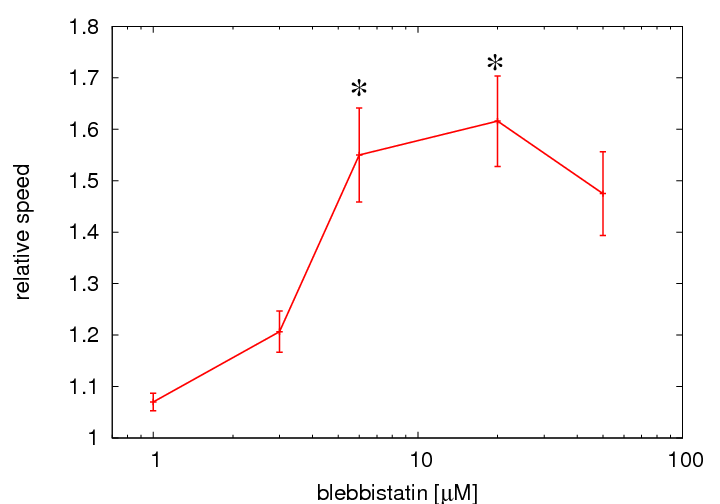
Figure 3: Normalized speed of nucleus movements in C6 cells as a function of blebbistatin concentration. Myosin II inhibition provokes increased
nuclear motility even at relatively high concentration of blebbistatin. The population average speed of nuclei in
blebbistatin treated cultures were normalized to similar averages obtained in parallel control cultures. The average
nuclear speed in control cultures is 7 ± 0.6 μm/h (n=9 fields). Error bars represent SEM, calculated from
independent microscopic fields (n=3 for 1 and 3 μM; n=4 for 6; n=9 for 20 μM; and n=2 for 50 μM.
Significance values p<0.05 in two-sided t-tests were considered significant and marked by asterisks). Each
analyzed field contained at least 100 tracked nuclei and more than 5000 nucleus positions.
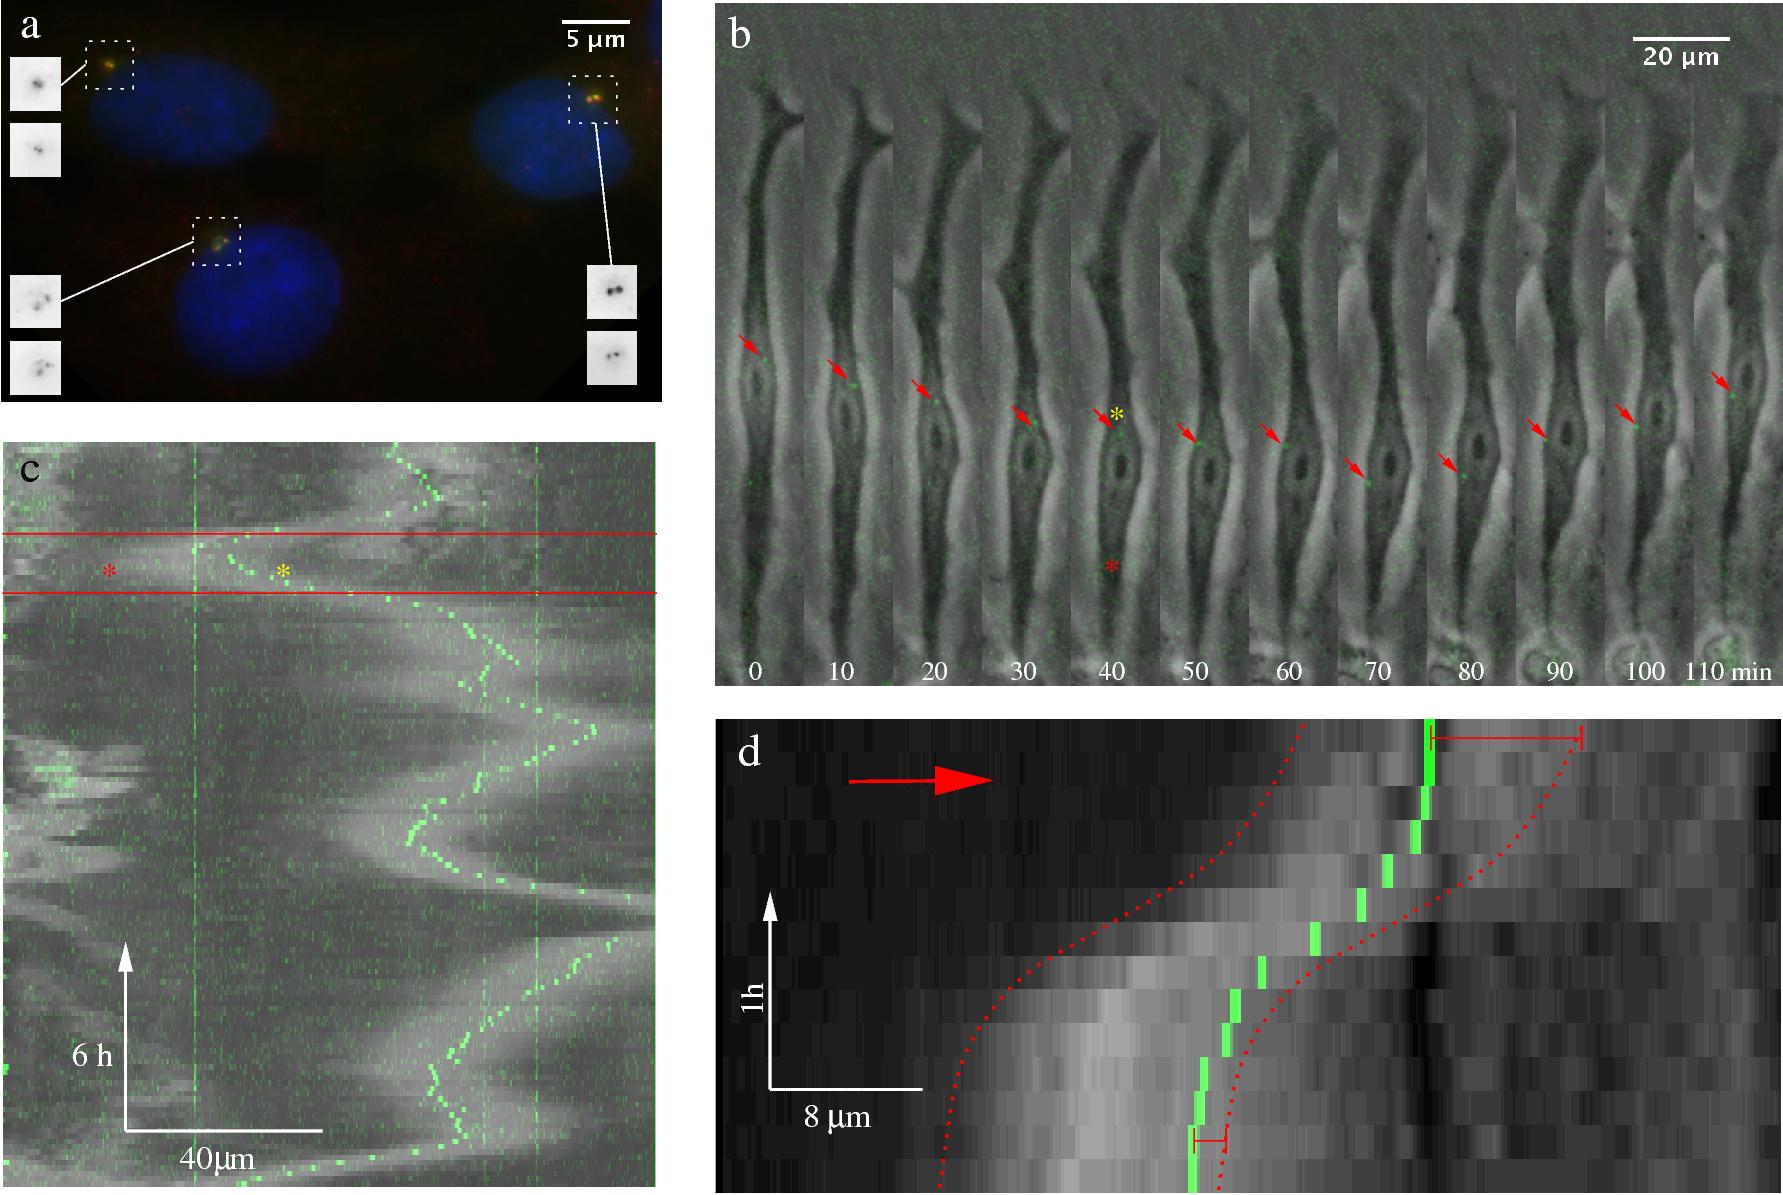
Figure 4: Centrosome position during nuclear
movement in C6 cells. a: The centrosome is visualized by GFP-centrin epifluorescence (green) in a typical cluster
of transfected C6 cells. Immunostaining with anti-centrin antibodies (red) gives exact co-localization (yellow) at
the resolution of the 100X oil immersion objective. Nuclei are stained with a Hoechst reagent (blue). Insets show
the red (top) and green (bottom) channels inverted for better contrast. b: A GFP-centrin transfected C6 cell,
cultured on a 20 μm wide micropatterned fibronectin-coated stripe, is shown in consecutive time points.
Grayscale phase contrast and green fluorescence time-lapse images were superimposed to show the centrosome
position (see also movie 7). Red arrows point to the centrosome. Approximate edges of the bright halo (a phase
contrast effect) surrounding the nucleus is marked by a red and a yellow asterisk. The image sequence depicts a
reversal of nucleus direction. During this particular event, the centrosome moved suddenly relative to the nucleus
(between frames taken at 60 and 70 minutes). c: Centrosome position during several nuclear oscillations. Intensity
profiles were obtained by projecting the brightest pixels in the direction perpendicular to the long cell axis.
Thus, a horizontal line of panel c corresponds to a single time-lapse frame, like those shown in panel b. Light
gray areas reveal the position of the phase contrast halo surrounding the nucleus, green dots mark the centrosome.
Frames shown in panel b correspond to the sequence between the red lines. Red and yellow asterisks label the same
locations as in the frame at 40 min in panel b. Some, but not all nuclear turns contain a sudden relocation of the
centrosome, similar to the event depicted in panel b. d: The nucleus tends to overtake the centrosome between the
turns. Intensity profiles, similar to panel c, are depicting nuclear and centrosome movement between two nuclear
direction reversals. The approximate leading and trailing nucleus boundaries are marked with red dotted lines.
While the centrosome initially is at the front of the nucleus, it lags behind: the upper red bracket is longer
than the lower one.
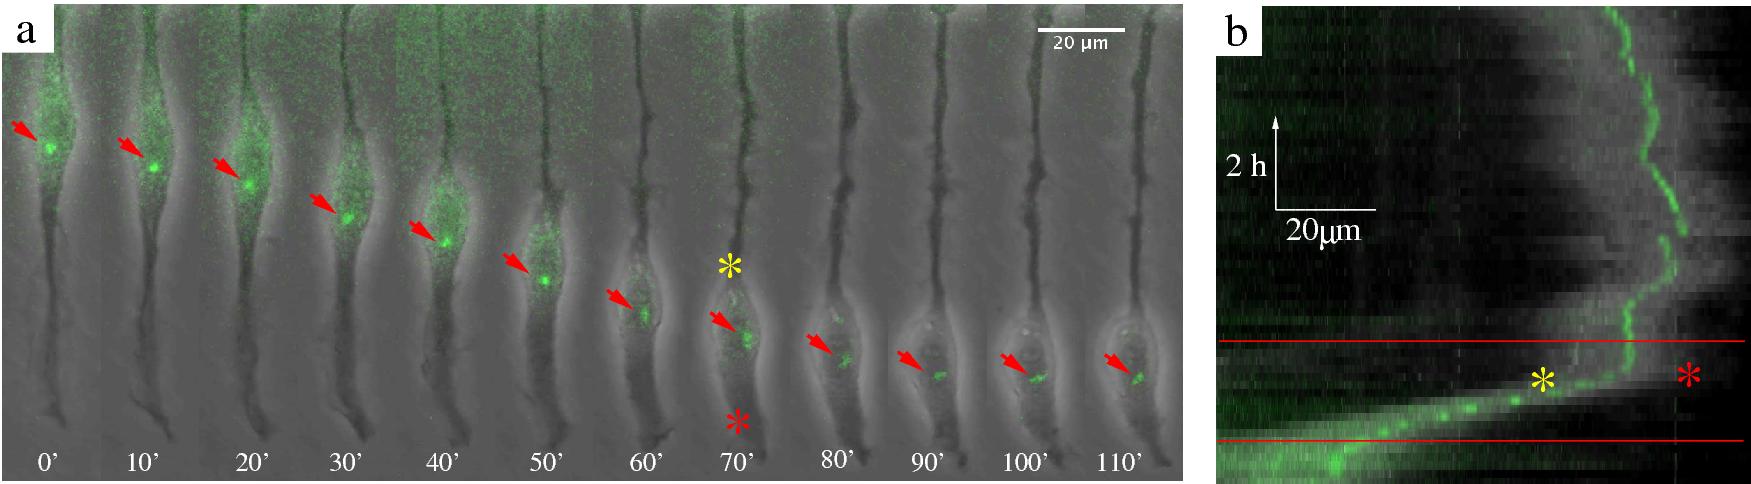
Figure 5: Centrosome position during blebbistatin-induced nuclear movement in C6 cells. a: The centrosome visualized by GFP-centrin
epifluorescence in a typical transfected C6 cell treated with 20 μM blebbistatin. Grayscale phase contrast
and green fluorescence time-lapse images were superimposed to show the centrosome position (See also movie 8).
Red arrows point to the centrosome. Approximate edges of the bright halo (a phase contrast effect) surrounding
the nucleus is marked by a red and yellow asterisk. b: Centrosome position during nuclear movement, plotted as in
Fig 4c. Frames shown in panel a correspond to the area between the red lines. Red and yellow asterisks mark the same
locations as in panel a. The centrosome tends to be in front of a moving nucleus. We did not observe rapid
alterations in the direction of blebbistatin-induced nuclear motility.
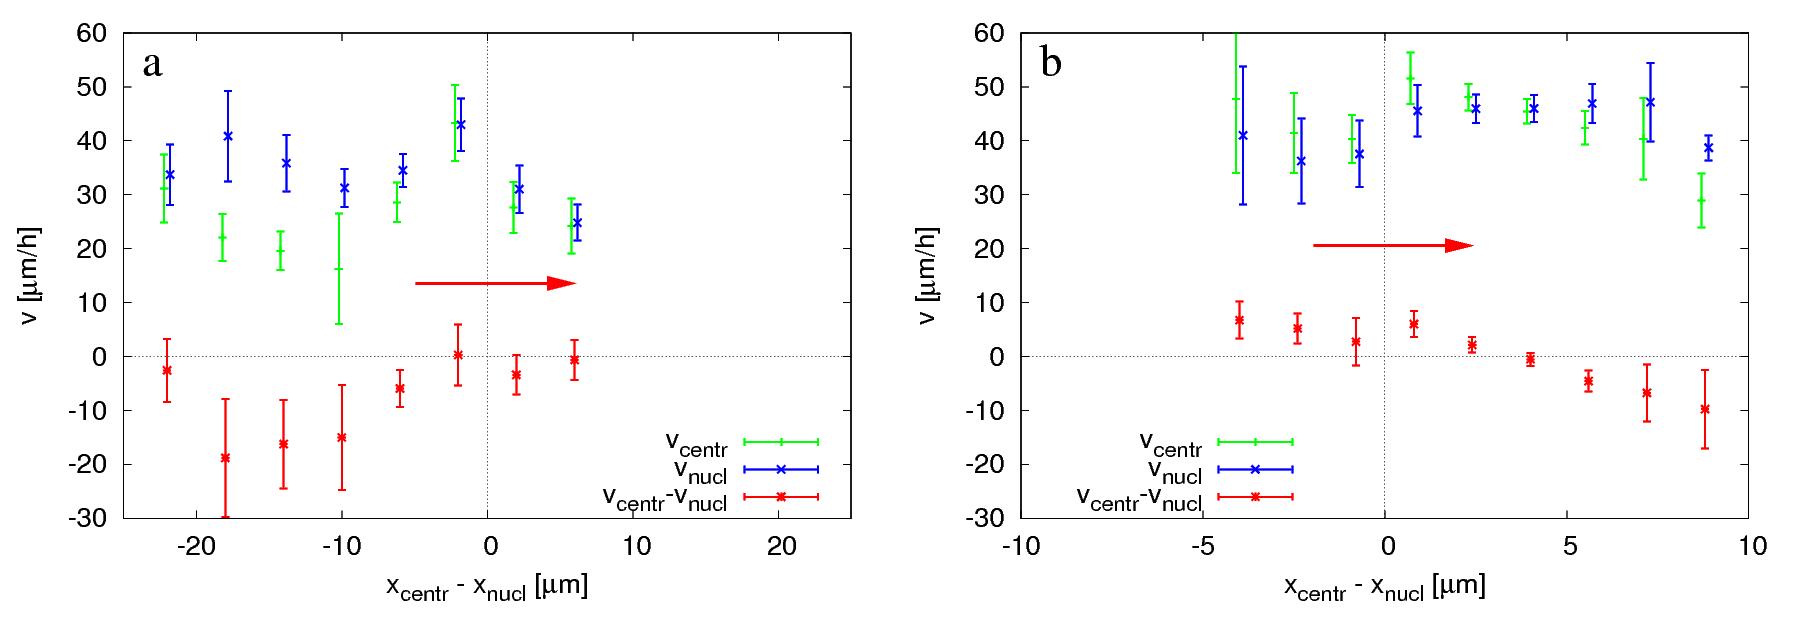
Figure 6: Average organelle speeds as a function of centrosome position, in
untreated (a) and 20 μM blebbistatin-treated cultures (b). Speed of the nucleus (blue) and the centrosome
(green) are plotted together with their relative speed (red). The presented data includes only cells in which the
nucleus moved faster than 5 μm/h and where the centrosome was detectable. At least 160 data points were binned
and averaged based on the relative position of the centrosome along the cell axis. Speed and position values were
obtained by projecting the two dimensional vector quantities to the direction of nuclear movement. Speed values
reflect instantaneous movements, calculated from displacements during 10 minutes. The more compact nucleus and cell
body of blebbistatin-treated cells is reflected by the smaller scale of position differences in panel (b). The
velocity of the two organelles are very similar, a consequence of the fact that in C6 cells the nucleus and the
centrosome remain in close proximity. Error bars represent SEM. Direction of nuclear movement is indicated by
horizontal red arrows.
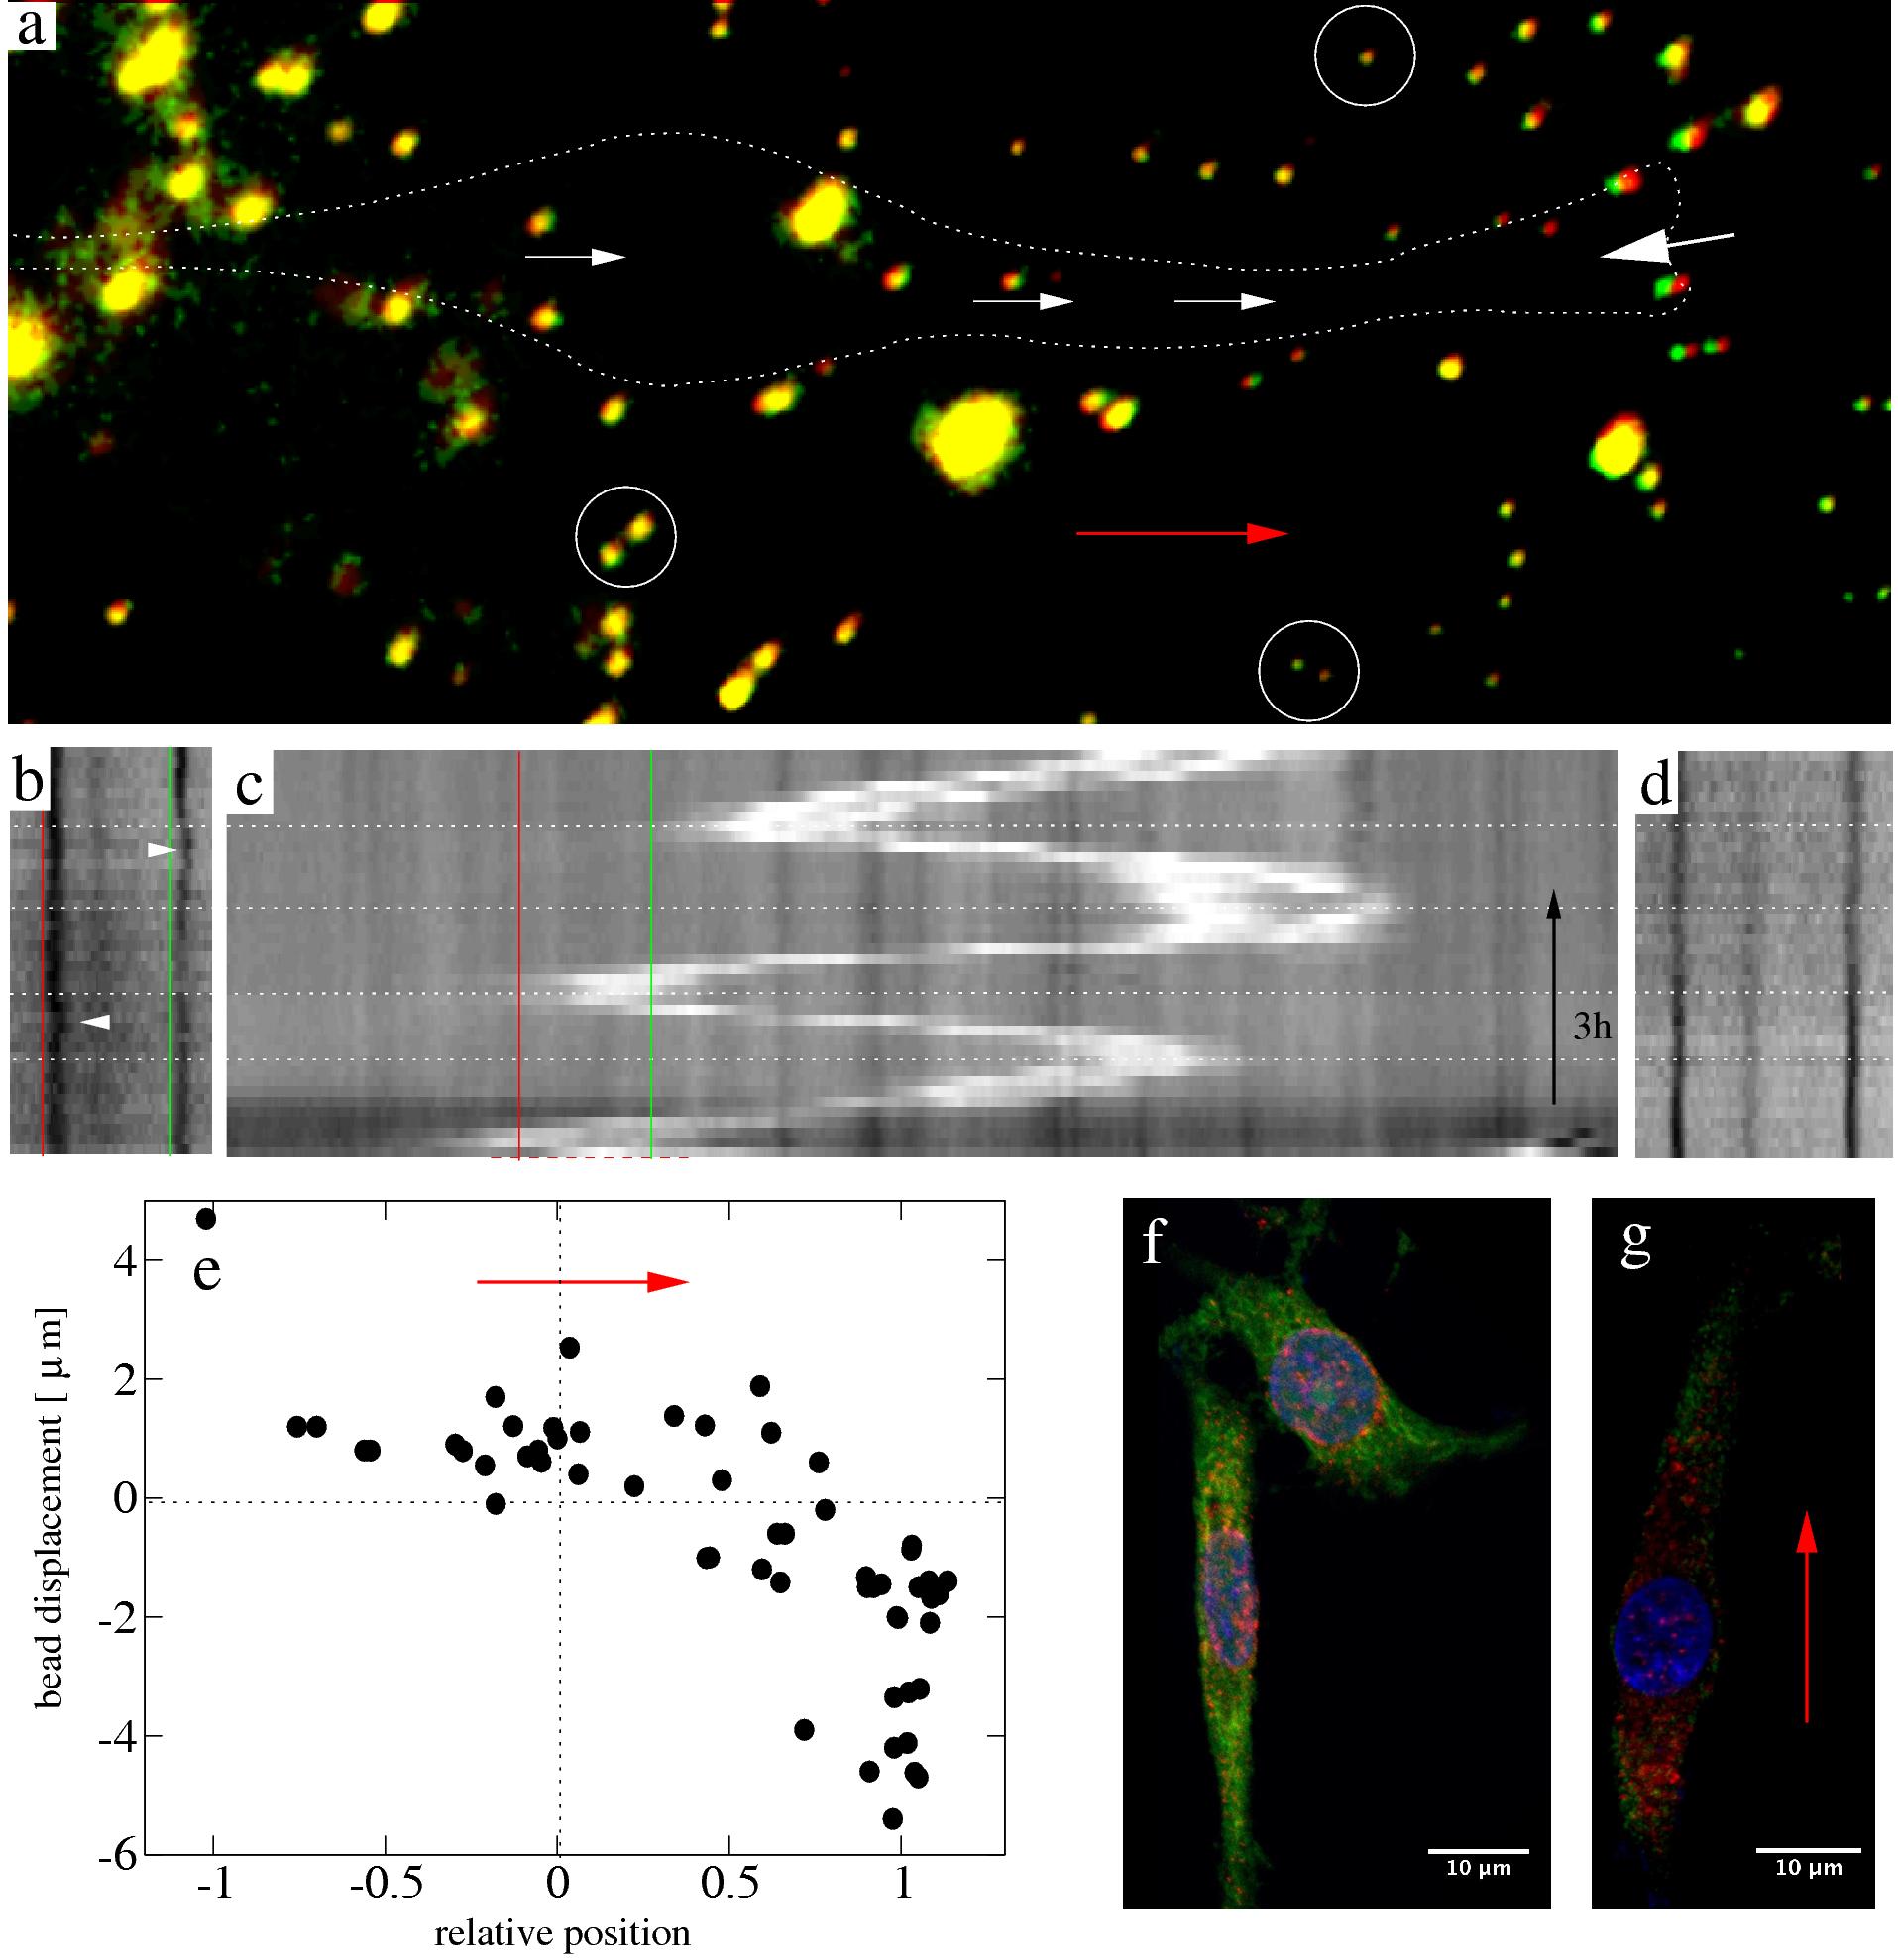
Figure 7: Substrate deformations indicate a
contraction between the leading edge and the nucleus during nuclear movement in spontaneously elongated C6 cells.
a: Bead positions (green) during nuclear movement of a cell outlined with dotted line, superimposed upon the
stress-free configuration obtained by trypsin treatment (red). Substantial bead displacements, characterized by
the lack of colocalization of green and red colors, are visible at the leading edge (large white arrow).
Displacements of smaller magnitude characterize the area surrounding the nucleus (small white arrows). Beads far
from the cell show no displacement (circles). The direction of nuclear movement is indicated by the red arrow.
Bead aggregates yield larger fluorescent blobs. b-d: Intensity profiles, obtained as in Fig.~4c, of a typical
oscillating cell show that bead displacements (b) change in synchrony with the direction of nuclear movements (c).
The nucleus appears as a bright stripe and horizontal dotted lines are visual guides, denoting phases of oscillating
nuclear movement. The vertical red and green lines, separated by 10 μm, mark the same location in both (b) and
(c). Arrowheads point to bead displacements. Beads far from the cell show no displacements during the same time
interval (d). e: Bead displacements, pooled from n=6 cells, are plotted against their relative position along the
front/rear axis of the cell. The zero and unit abscissa values denote the nucleus and the leading edge,
respectively. Positive displacements are parallel to the direction of cell movement, indicated by the red arrow.
f: Immunocytochemical localization of pMLC (red) in C6 cells, superimposed upon images of phalloidin-labeled
filamentous actin (green) and a Hoechst nuclear stain (blue). The distribution of pMLC labeled foci is quite
symmetric in both well spread and elongated cells. The vicinity of the nucleus is the source of the most intense
pMLC immunofluorescence. g: Immunocytochemical localization of pMLC (red) superimposed upon images of vinculin
immunofluorescence (green) and a Hoechst nuclear stain (blue). A C6 cell is shown in which the nucleus moved
intensively in the direction marked by the red arrow. pMLC can be found both in the front and in the rear of the
nucleus. The viculin immunostaining indicates the presence of scattered small adhesion sites instead of extended
focal contacts characteristic of fully spread C6 cells in culture.
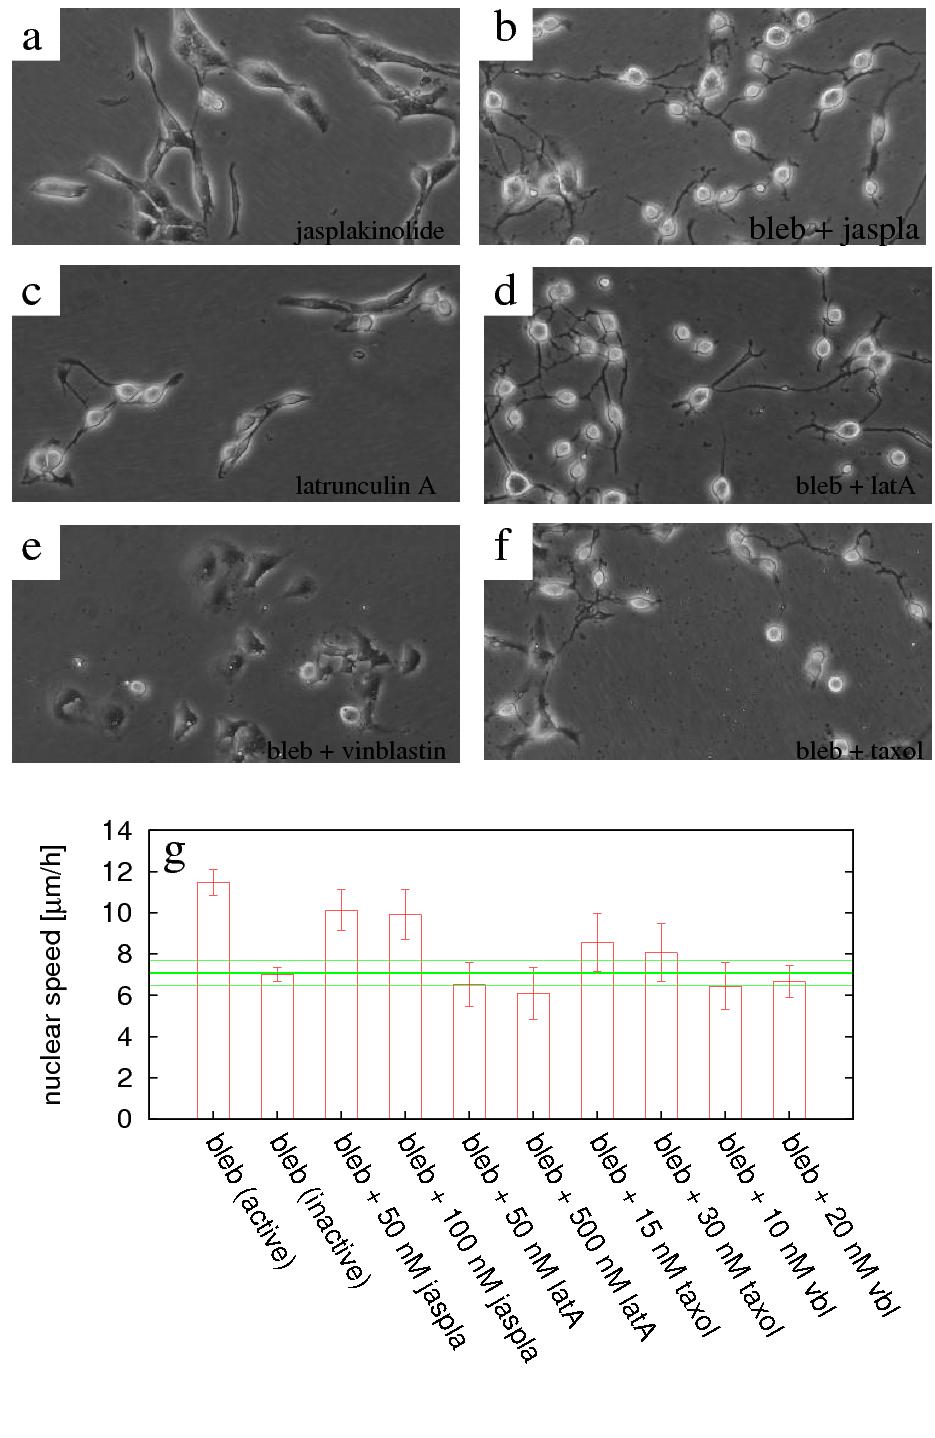
Figure 8: The role of normal cytoskeletal turnover in nuclear
motility. C6 cells are exposed to microtubule and F-actin stabilizing and destabilizing agents: taxol, vinblastin,
jasplakinolide and latrunculin A. Characteristic cell morphologies are shown for 100 nM jasplakinolide (a),
together with 20 μM blebbistatin (b); 50 nM latrunculin A (c), together with 20 μM blebbistatin (d); and
20 nM vinblastine (e) and 30 nM taxol (f) together with 20 μM blebbistatin. g: Population and time-averaged
nuclear speeds, obtained by automatic tracking, are compared to that of untreated cultures at $7\pm 0.6$ μm/h
(green lines). Blebbistatin concentration is 20 μM. The labels jaspla, latA and vbl indicate jasplakinolide,
latrunculin A and vinblastine, respectively. Error bars represent standard error of the mean. See also movies 9
and 10
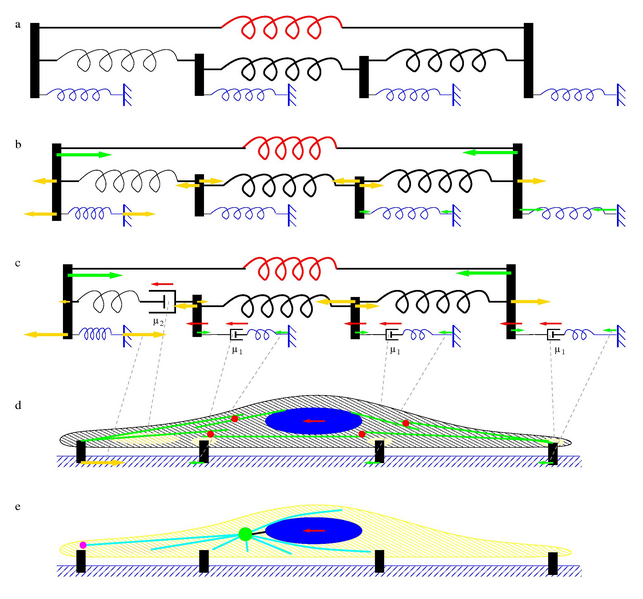
Figure 9: Schematic model of cytoskeletal dynamics during nuclear
movements. We consider a system of an active contractile element (red spring) and a chain of passive elements (black
springs) attached to an elastic environment (blue objects). a: If the active element is turned off, no forces are
present in the system. b: When the active element contracts, this force is balanced by the compression of the
passive elements and deformation of the environment. Forces exerted by the elements are represented by arrows.
Compression and tension of the elements is indicated by yellow and green vectors, respectively. We assume that
the passive element in the front (the spring drawn with a thinner line) is more compliant, which creates an uneven
compression pattern and a matching asymmetry in forces within the environment (forces exerted by the blue springs).
c: To accommodate a sustained movement of a large part of the structure (red arrows) we introduce elements,
represented by dashpots, which can dissipate mechanical stress. The spring and dashpot in a serial arrangement
models the cytoskeleton as a viscoelastic Maxwell fluid. The dissipative elements couple the speed of movement
and the force exerted upon the element, the conversion factors are marked as μ1 and μ2. Forces can be
established by requiring mechanical equilibrium and the co-movement of the elements marked by red arrows. d: The
elements shown in panel c are represented within a cartoon of a contractile cell. Traction forces exerted by the
cell are marked as vectors and matched with the corresponding forces by dashed gray lines. The passive cytoskeleton
is represented as a hatch pattern. Areas where we assume intensive dissipation of mechanical tension (remodeling)
are marked yellow and matched by the corresponding dashpots with gray dashed lines. The active contractile elements
are shown as green lines (actin filaments) and red disks (myosin II motors). e: In the absence of myosin II
activity, the cytoskeleton is more compliant, and we envision a microtubule-based mechanism to move the nucleus:
Cortical motors (magenta) pull the astral microtubules (cyan) and the centrosome (green disk), which in turn, is
linked (thick black line) to the nucleus. This mechanism may operate in parallel with the myosin II dependent
contractility shown in panel d.
Supplemental movies
Video 1:
Untreated single radial glia-like cell engages in an oscillatory nuclear motion, similar to INM.
Video 2:
20 μM blebbistatin treated single radial glia-like cell engages in a fast oscillatory nuclear motion,
similar to INM.
Video 3: Morphology change and coincident increased nuclear motility induced by 20
μM blebbistatin in radial glia-like cells.
Video 4: Morphology change and coincident increased nuclear motility induced by 20
μM blebbistatin in C6 cells.
Video 5: Wash out.
Video 6: Inactive blebbistatin, ML7, Y, ML7+Y.
Video 7: The centrosome visualized by GFP-centrin epifluorescence in a typical transfected
C6 cell, cultured on a 20 μm wide micropatterned fibronectin-coated stripe. Grayscale phase contrast and green
fluorescence time-lapse images were superimposed to show the centrosome position.
Video 8: The centrosome visualized by GFP-centrin epifluorescence in a typical transfected
C6 cell treated with 20 μM blebbistatin. Grayscale phase contrast and green fluorescence time-lapse images were
superimposed to show the centrosome position.
Video 9: Jasplakinolide and latrunculin A.
Video 10: Taxol and vinblastine.